August 12, 2025
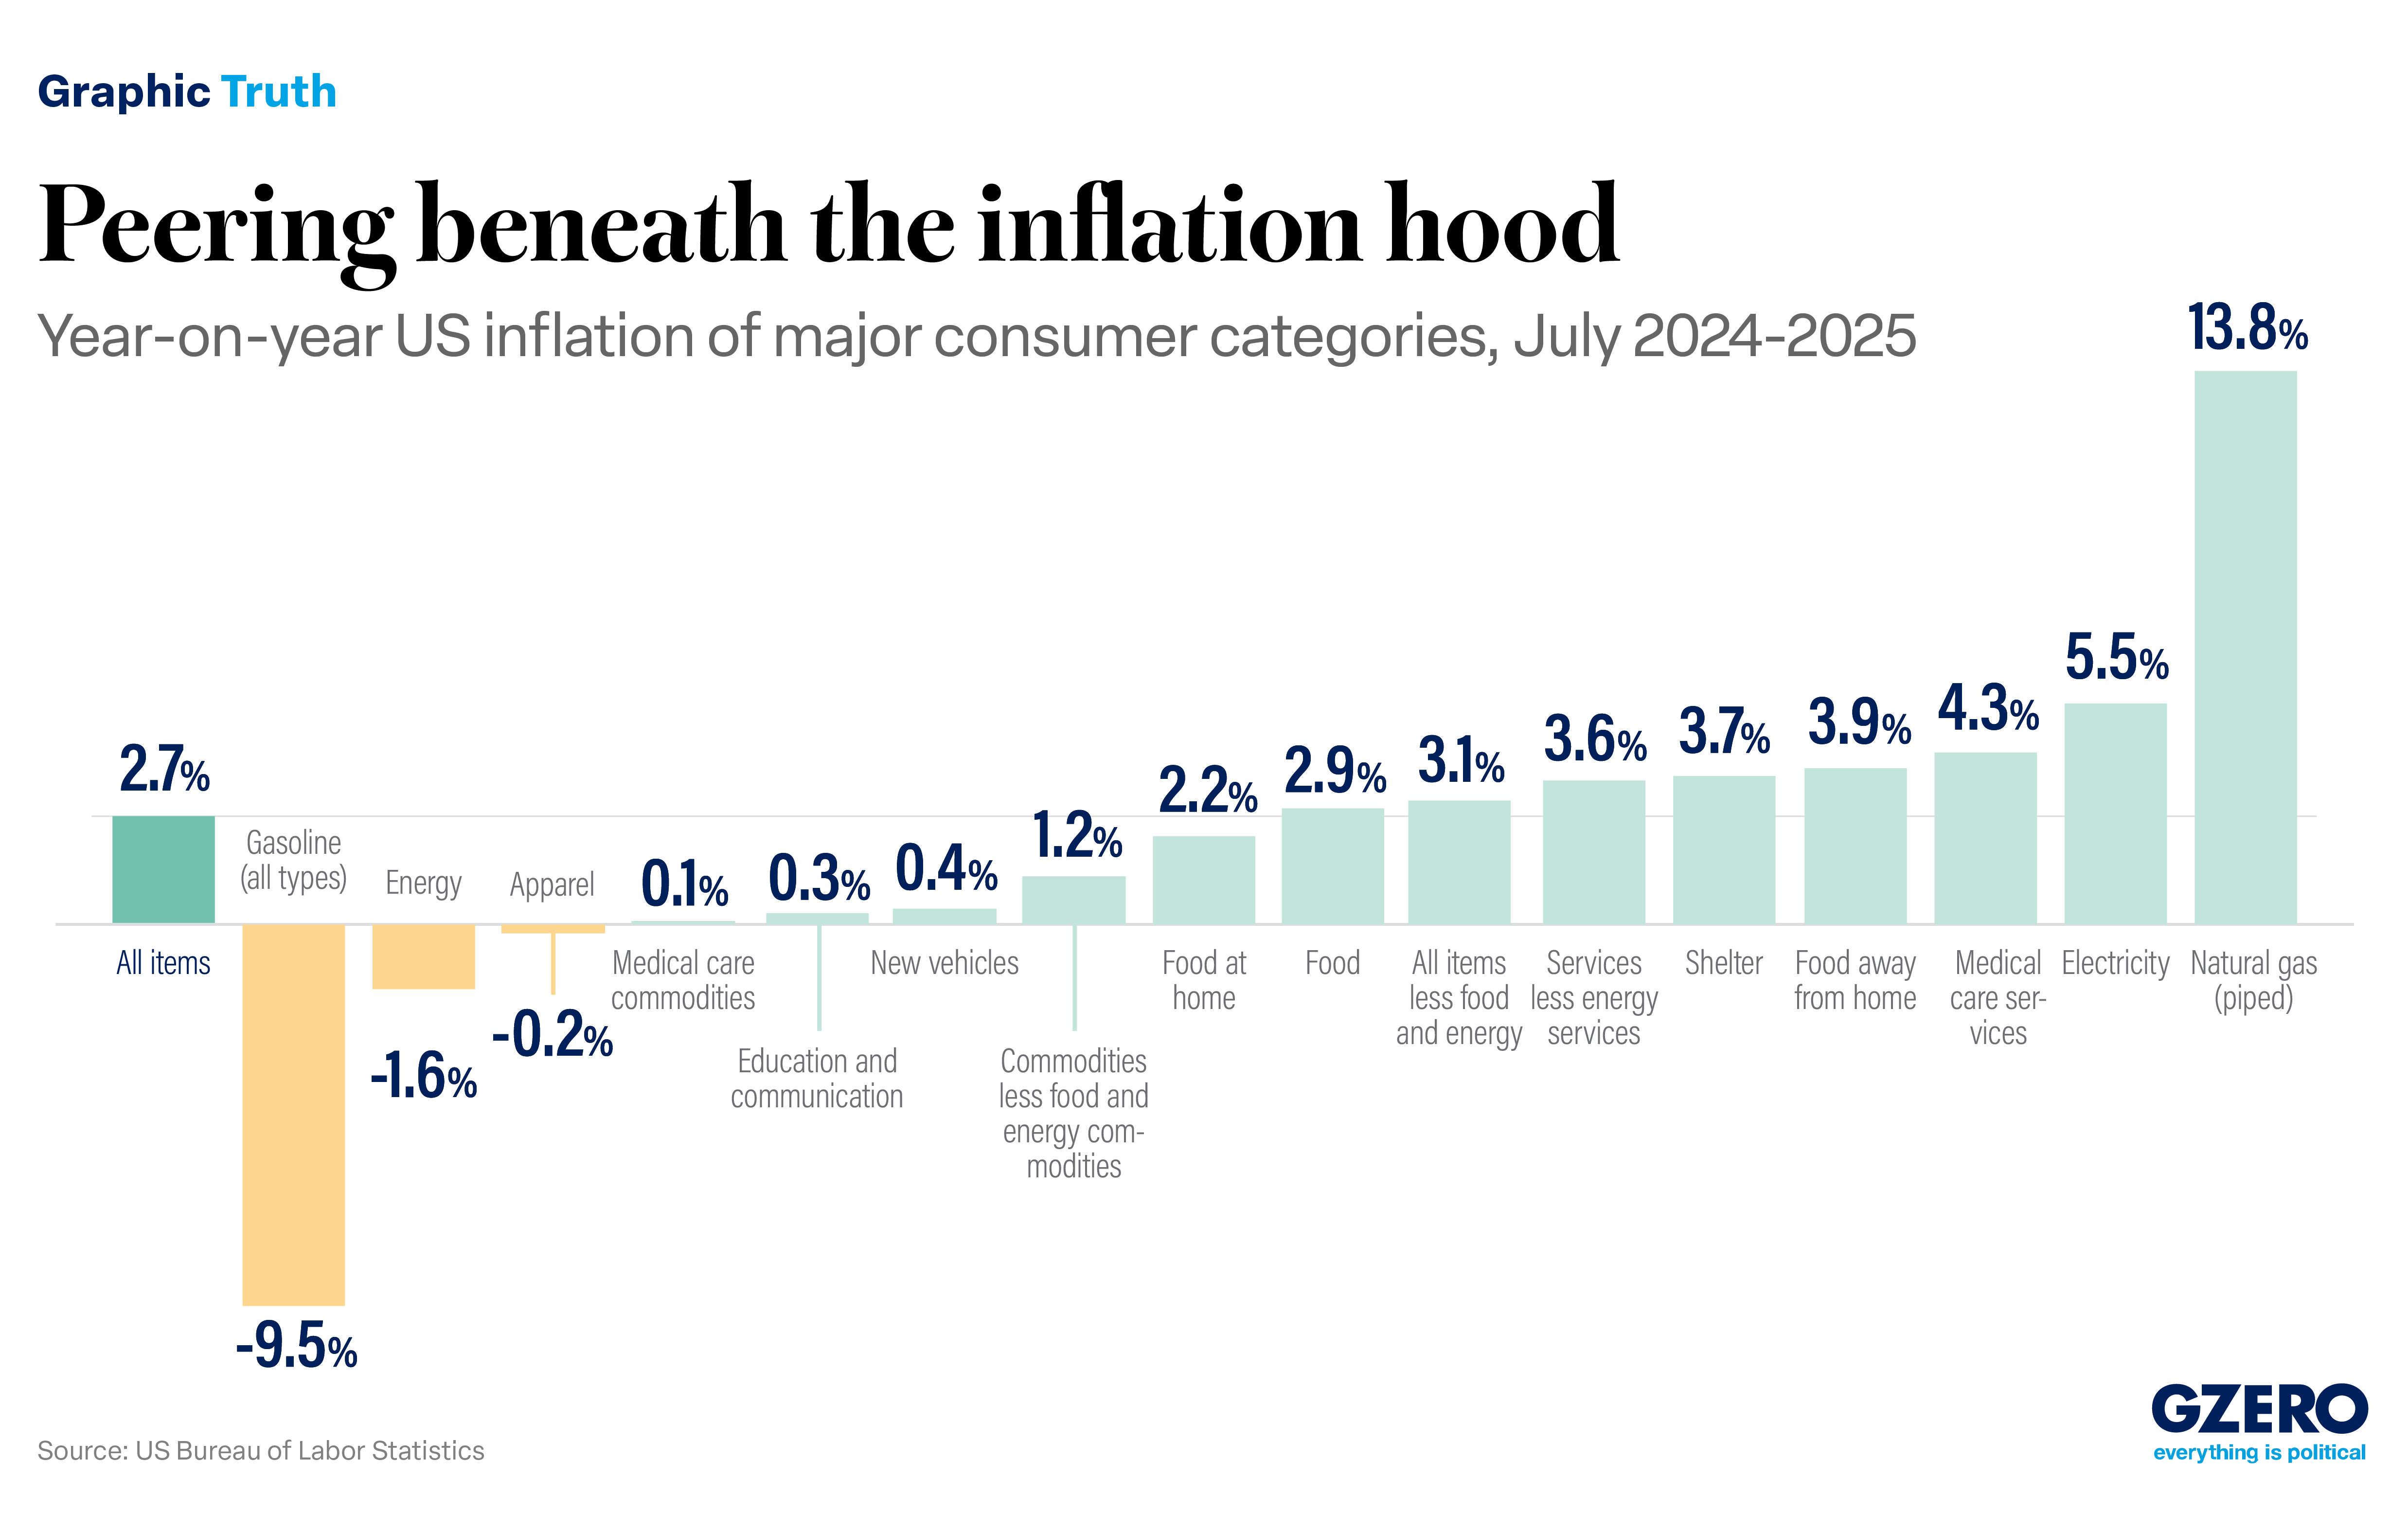
US prices rose 2.7% over the 12 months until July 2025, a relatively steady rate despite the onset of President Donald Trump’s tariffs. But what’s behind this inflation figure? This Graphic Truth explores how the prices of various categories of consumer goods are changing.
More For You
U.S. President Donald Trump speaks at the Resolute Desk before signing an executive order on vehicle repairs in the Oval Office at the White House on June 29, 2026 in Washington, D.C.
Samuel Corum/Sipa USA
What, exactly, is the Trump administration thinking? A well-worn question finds fresh fodder this week as the White House prepares to impose a sweeping new set of tariffs on Brazil. Again.
Most Popular
Sponsored posts
Microsoft’s 2026 Environmental Sustainability Report
Walmart sponsored posts
Empowering associates with comprehensive benefits
Another prime minister arrived at Downing Street today. Andy Burnham became the United Kingdom’s seventh leader in just 10 years. The Graphic Truth maps out the duration of the United Kingdom's prime ministers in office.
Supporters of the Cockroach Janta Party march toward parliament on the opening day of its monsoon session, demanding the resignation of Education Minister Dharmendra Pradhan over exam paper leaks, in New Delhi, India, 20 July, 2026.
REUTERS/Adnan Abidi
In New Delhi, thousands of protesters are marching to Parliament today to demand the resignation of education minister Dharmendra Pradhan over a growing scandal surrounding the leak of a high-stakes med school entrance exam in May
© 2025 GZERO Media. All Rights Reserved | A Eurasia Group media company.