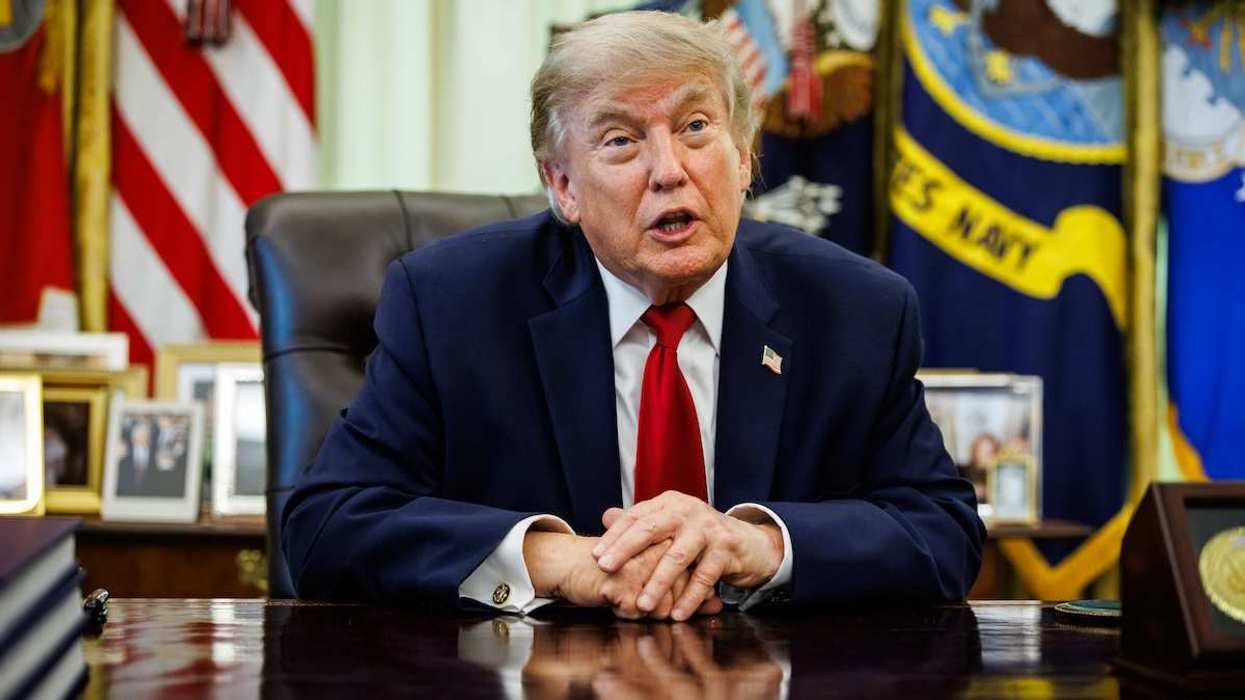
US prices rose 2.7% over the 12 months until July 2025, a relatively steady rate despite the onset of President Donald Trump’s tariffs. But what’s behind this inflation figure? This Graphic Truth explores how the prices of various categories of consumer goods are changing.
Graphic Truth
Graphic Truth: What’s behind the US inflation numbers?

Eileen Zhang

By Zac WeiszAugust 12, 2025
Zac Weisz
Zac reports on global affairs, covering everything from elections and international relations, to conflicts in Africa, Europe, and the Middle East. With the Trump administration keen to alter the world order, though, there’s a heavy emphasis right now on US politics – an area with which he is intimately familiar. He also reports on the cross-section between sports and geopolitics. Prior to joining GZERO, Zac was a senior national politics correspondent at National Journal, where he covered the 2024 presidential election from its inception to the dramatic finish, as well as major congressional actions during the Biden administration. Prior to journalism, Zac worked as an economic analyst for Oxford Economics, calculating the impact of various tax policies, as well as the United Kingdom’s exit from the European Union. Born in London, he currently resides in New York City, where you can find him playing football (the original version) or watching it on television while attempting to cook up a storm.